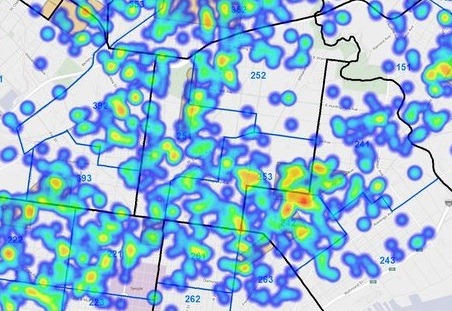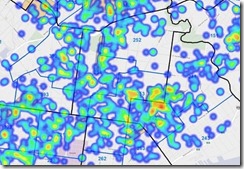
A heat map is a graphical representation of data where the individual values contained in a matrix are represented as colors.
This article will attempt to explain the process of creating and using GHEAT-JAVA, which is a port of famous aspen based gheat and took great inspiration from Gheat.net
Writing a service which would serve heat map tiles is a bit tricky, there are three major components involved
- The client part i.e. some kind of mapping library which has a concept of layer, I chose Google maps.
- The data source part, i.e. a spatially aware database or an in memory data structure, I have used postgres ,an in memory quad tree and a flat file as data sources.
- The renderer part or basically the code which accepts requests, parses tile bounds, fetches data and then renders gradients on the tile and later colorizes them.
The Tiling layer (Client part)
#
Google maps allows developers to add a custom layer, the code looks like this